
You are currently browsing the tag archive for the ‘Analytics’ tag.
More than 13,000 self-described “data and visualization nerds” gathered in Austin, TX, recently for Tableau Software’s annual customer conference. In his inaugural keynote, Tableau’s new CEO, Adam Selipsky, said that nearly 9,000 were first-time attendees. I was impressed with the enthusiasm of the customers who had gathered for the event, cheering as company officials reviewed product plans and demonstrated new features. This enthusiasm suggests Tableau has provided capabilities that resonate with its users. Among other things, the company used the conference to outline a number of planned product enhancements.
Not resting on its laurels as a data visualization software provider, Tableau demonstrated a variety of new capabilities for displaying data. Enhanced tool tips were common to several of the new features. For example, visualization within visualization displays a graph on top of another graph as the user hovers over data points. Hover lines, which are vertical lines on charts, show a variety of data values not just the data value in the chart. Interactive tool tips showing values used to filter the displayed data can show items with similar characteristics in the charts or graphs.
Mapping capabilities are enhanced so that layers of different sets of data or different types of location data can be displayed simultaneously. Tableau executives also demonstrated a natural-language query interface that can interpret concepts such as “near” or “expensive” using machine-learning techniques. All in all, these interface enhancements make it easier for users to get more information as they are navigating through data.
Data preparation is a hot topic, as I have written. For its part Tableau is adding self-service data preparation through an effort called Project Maestro. Data preparation will be a stand-alone application that enables users to access and prepare data prior to visualization. With interactive capabilities to join tables, split fields and profile data, users can be more certain that the data is ready for the analyses that they want to perform. Long having focused on business users, Tableau is trying to appeal to IT also by introducing new governance capabilities to Tableau Server. As data sources are published, they can be reviewed and certified. IT personnel can ensure that the proper joins, security rules and performance optimizations are incorporated. Business users can trust the content on which they are relying. The governance features will also include the frequency of usage and impact analysis to identify where data sources are used.
In some other areas Tableau is catching up with the competition, adding features that users value but were missing from its products previously. One example is alerts. Another is collaboration, including threaded discussions in which analyses can be embedded. I’ve written about the value of collaboration for years. Our data and analytics in the cloud benchmark research shows that more than half (52%) of organizations use or intend to use collaboration with analytics. Users should welcome these new features, but Tableau could make collaboration even more valuable by adding tasks or assignments so that analysis can lead to action, not just discussion. Tableau also continues to round out its cloud capabilities, but like some other vendors its cloud implementation has not achieved parity with the desktop product. As part of its cloud efforts, Tableau also announced a Linux version of its server, which is a common operating system for cloud-based systems.
Tableau will also be introducing a new data engine based its acquisition of Hyper earlier this year. Tableau uses an in-memory data engine to accelerate the speed of interacting with data, but the current engine has posed two limitations that it hopes to address with Hyper. The first is scalability, and the second is near-real-time capabilities. During the conference the company demonstrated a development version of Hyper loading more than 300,000 rows per second. The Hyper architecture allows data loading to happen simultaneously with querying, eliminating down time. Hyper will appear first in Tableau’s cloud offerings as a proving ground and later in the on-premises versions.
The conference allowed Tableau to polish its core strengths of visualization and usability. It promises a set of valuable enhancements as well as some features that will help it keep up with the competition. Most of these new features are scheduled to be released in 2017. Tableau has also advanced its mobile capabilities to address its gaps I identified in the 2016 Ventana Research Mobile Business Intelligence Value Index to more easily consume analytics on smartphones and tablets. Tableau has a loyal following of customers that allows it the luxury of time to deliver these capabilities. You may want to check these out, too, especially the clever visualization techniques being added.
Regards,
David Menninger
SVP & Research Director
Follow Me on Twitter @dmenningerVR and Connect with me on LinkedIn.
Data preparation is critical to the effectiveness of both operational and analytic business processes. Operational processes today are fed by streams of constantly generated data. Our data and analytics in the cloud benchmark research shows that more than half (55%) 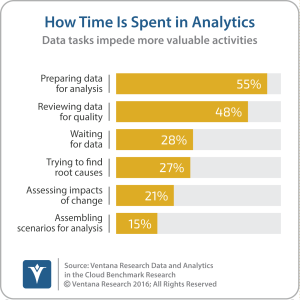 of organizations spend the most time in their analytic processes preparing data for analysis – a situation that reduces their productivity. Data now comes from more sources than ever, at a faster pace and in a dizzying array of formats; it often contains inconsistencies in both structure and content.
In response to these changing information conditions, data preparation technology is evolving. Big data, data science, streaming data and self-service all are impacting the way organizations collect and prepare data. Data sources used in analytic processes now include cloud-based data and external data. Many data sources now include large amounts of unstructured data, in contrast to just a few years ago when most organizations focused primarily on structured data. Our big data analytics benchmark research shows that nearly half (49%) include unstructured content such as documents or Web pages in their analyses.
The ways in which data is stored in organizations are changing as well. Historically, data was extracted, transformed and loaded, and only then made available to end users through data warehouses or data marts. Now data warehouses are being supplemented with, or in some cases replaced by, data lakes, which I have written about. As a result, the data preparation process may involve not just loading raw information into a data lake, but also retrieving and refining information from it.
The advent of big data technologies such as Hadoop and NoSQL databases intensifies the need to apply data science techniques to make sense of these volumes of information. In this case querying and reporting over such large amounts of information are both inefficient and ineffective analytical techniques. And using data science means addressing additional data preparation requirements such as normalizing, sampling, binning and dealing with missing or outlying values. For example, in our next-generation predictive analytics benchmark research 83 percent of organizations reported using sampling in preparing their analyses. Data scientists also frequently use sandboxes – copies of the data that can be manipulated without impacting operational processes or production data sources. Managing sandboxes adds yet another challenge to the data preparation process.
Data governance is always a challenge; in this new world it has if anything grown even more difficult as the volume and variety of data grow. At the moment most big data technologies trail their relational database counterparts in providing data governance capabilities. The developers of data preparation processes must adapt them to these new environments, supplementing them with processes that support governance and compliance of personally identifiable information (PII), payment card information (PCI), protected health information (PHI) and other standards for the handling of sensitive, restricted data.
In the emerging self-service approach to data preparation, three separate user personas typically are employed. Operational teams need to derive useful information from data as soon as it is generated to complete business transactions and keep operations flowing smoothly. Analysts need access to relevant information to guide better decision-making. And the IT organization is often called upon to support either or both of these roles when the complexities of data access and preparation exceed the skills of those in the lines of business. While IT departments probably welcome the opportunity to enable end users to perform more self-service tasks, they cannot do so to the extent that it ignores enterprise requirements. Nonetheless, the trend toward deploying tools that support self-service data preparation is growing. These two trends can lead to conflict for organizations that want to derive maximum business value from their data as quickly as possible while still maintaining appropriate data governance, security and consistency.
To help understand how organizations are tackling these changes, Ventana Research is conducting benchmark research on data preparation. This research will identify existing and planned approaches and related technologies, best practices for implementing them and market trends in data preparation. It will assess the current challenges associated with innovations in data preparation, including self-service capabilities and architectures that support big data environments. The research will assess the extent to which tools and processes for data preparation support superior performance and determine how organizations balance the demand for self-service capabilities with enterprise requirements for data governance and repeatability. It will uncover ways in which data preparation and supporting technologies are being used to enhance operational and analytic processes.
This research also will provide new insights into the changes now occurring in business and IT functions as organizations seek to capitalize on data preparation to gain competitive advantage and help with regulatory compliance and risk management and governance processes. The research will investigate how organizations are implementing data preparation tools to support all types of operational and business processes including operational intelligence, business intelligence and data science.
Data is an essential component of every aspect of business, and organizations that use it well are likely to gain advantages over competitors that do not. Watch our community for updates. We expect the research to reveal impactful insights that will help business and IT. When it is complete, we’ll share education and best practices about how organizations can tackle these challenges and opportunities.
Regards,
David Menninger
SVP & Research Director
Follow Me on Twitter @dmenningerVR and Connect with me on LinkedIn.
 LinkedIn
 Twitter
 Facebook Fan Page
 Ventana Research Website